Under the Hood of the AI Index: What the Numbers Are Saying
The year began with turbulence. The index is down 12% YTD, reflecting the broader market’s volatility. Pulling back the lens, there are some interesting insights, especially when we dissect the index between the compute, infrastructure and application layer
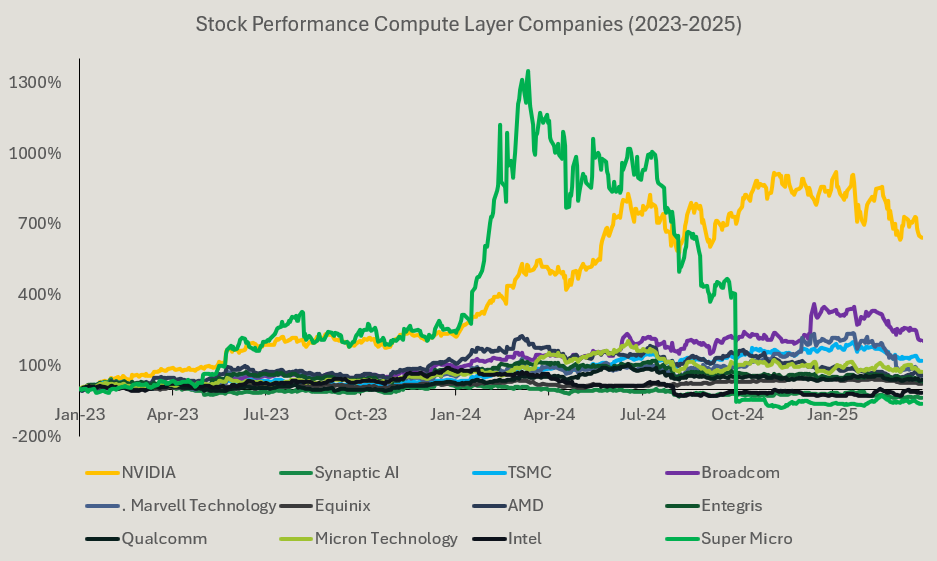
Compute Still Reigns
It’s no surprise that the compute and hardware layer has delivered the strongest returns. As hyperscalers and foundational research labs made major investments in compute, companies like NVIDIA (642% return), TSMC (123% return), and Broadcom (209% return) have been among the key early beneficiaries.
This layer shows the highest median EBITDA margin (26%) and strong median YoY growth (22%). Yet, it doesn't command the highest valuations. Its median EV/NTM is 5.6x—lower than both the infrastructure and application layers.
Infrastructure: A Study in Contrasts
This layer shows the lowest median YoY growth (14%) and a more moderate median EBITDA margin (17%) but commands the highest median NTM valuation multiple (7.9x). Inside the basket, performance varies—Meta delivered outstanding returns (379%), while others experienced high volatility. Palo Alto rose as high as 200% but now sits at 22%, and MongoDB peaked at 140% and is now at -11%.
Application: Boom or Bust
The application layer has seen solid median YoY growth (21%) but lower profitability, with median EBITDA margins at 14%. It commands a 6.5x median revenue multiple. Notable standouts include Palantir, which delivered the highest return in the index (1,215%) and trades at a steep 51x NTM revenue multiple. This layer also includes two companies that face high risk of disruption with AI NICE (-20% return) and UiPath (-19%).
Revenue Growth vs EBITDA vs Multiples
When we measure the strength of the statistical link between these factors and valuation multiples, revenue growth (at 0.17) shows a connection that is over 8 times stronger than that of profitability (at 0.02) within this dataset. Showing how investors are still valuing more growth.
Companies with higher growth rates (>19%) have notably higher median valuation multiples (6.8x) compared to companies with lower growth (≤19%, median 5.7x). Exceptional examples include Astera Labs (179% growth, 13.0x multiple) and Snowflake (27% growth, 10.3x multiple), where rapid growth clearly compensates for poor profitability.
Index Summary:
The AI Index tracks the performance of leading public companies prioritizing generative AI initiatives.
In March, the Flybridge AI Index returned -8%. For the prior 12 months, the Index has returned -9% to its current level of 106% since January of 2023.
Out of the 32 active companies in the Index, 4 rose in October, while 28 declined.
Gainers include Nice (+10%), and AMD (+5%). Significant decliners include MongoDB (-32%), and Marvell (-28%).
The median NTM revenue multiple was 6.5x, with a median quarterly YoY revenue growth rate of 20%.
We thank Aiera, an AI-powered equity research platform, for accelerating our data and insight extraction process.
Note: These insights are focused on AI developments and priorities as discussed in management publications, earnings calls, and other company announcements.


